What data is available on klikit Analytics?
klikit Analytics is a comprehensive, consolidated, and real-time view of your data from the food delivery apps you use, your webshop and social media channels. Get all your data in one powerful dashboard!
What data can I see on the app?
Our goal with the klikit for Business App is to provide the information that is critical to your store managers - on Sales, Cancellations etc. From this - they should be able to provide you any insight required, as well as make and manage improvements in store.
This information is captured on the 'Home' Tab, under 'Order Summary'.
See the definitions below:
- Completed Orders = Total Number of Orders that reached 'Complete'
- Cancelled Orders = Total Number of Cancelled Orders
- Gross Order Value = Total Sales Figure (not incl. Discounts)
- Discount Value = Total Sum of Promotions Availed (Merchant or Aggregator Funded)

Note - that the date range on this can be edited and modified by selecting the toggle in the top right of 'Order Summary'.
How do I access klikit Analytics?

Analytics are also available on the klikit for Business App but it is limited to the most relevant data (such as Sales and Cancellations) that your store managers need for day to day management.
To access your reports, log-in the klikit web app, then select the Analytics tab on your klikit dashboard. Here you will be presented with the data of all your brands, branches, and aggregators for the last 365 days! klikit users can enjoy the following data points:
- Gross Order Value vs Lost Revenue
- Completed vs Cancelled Orders
- Average Basket Size
- Payment Method
- Orders per Menu Category, Menu Item, and Modifier
- Discounts Data
- Order Breakdown data

Not sure what a metric means? Hover over the tooltips for a quick guide!
[INTERACTIVE TUTORIAL] How do I navigate the different klikit Analytics tabs?
Feel free to use our filters, and don’t forget to click “Apply Filter”. You can use the following filters:
- Brand
- Branch
- Aggregator / Channel of Orders
- Range of Date and Time

Analytics contains sensitive data about your business - please ensure only appropriate users have access.
Your data can downloaded in csv, excel, or Google sheets format. Simply look for the Download button. If there are too many rows, don't stress we will simply email you a copy.
With the following data you can plan your strategy for promotion to scale up your business:
Summary
- This summarizes your performance. Completed Orders is the total number of completed orders, while cancelled orders is the total number of orders placed that were not completed. Total Orders is the number of all orders, whether completed or cancelled. Gross Order Value is the amount earned from completed orders, while Lost Revenue is the amount foregone from cancelled orders. You can differentiate the order channel by seeing the different color on the graphic.
Performance
- Track and analyze your restaurant’s overall performance via Brand, Branch or Branch Comparison Features.
- Brand
- Branch
- Branch Comparison, including the order channel based on color code
Number of Brands, Branches, Aggregators, Markets
- Get a snapshot of the number of overall and active brands, branches, aggregators and markets under your business.
Gross Order Value vs Lost Revenue
- Gain insights into your revenue performance and identify areas where revenue might be lost. The graph including the order channel based on color code
Completed vs Cancelled Orders
- Understand your order fulfillment rates and identify any patterns in order cancellations. The graph including the order channel based on color code
Out of Stock
- Track your Out of Stock items or Modifiers via the OOS Report or OOS logs feature. You may download the report as CSV file.
Average Basket Size
- Analyze the average value of orders to tailor your marketing and pricing strategies. The graph including the order channel based on color code
Payment Method Analytics
- See which payment methods are most popular among your customers. You may download the report as CSV file.
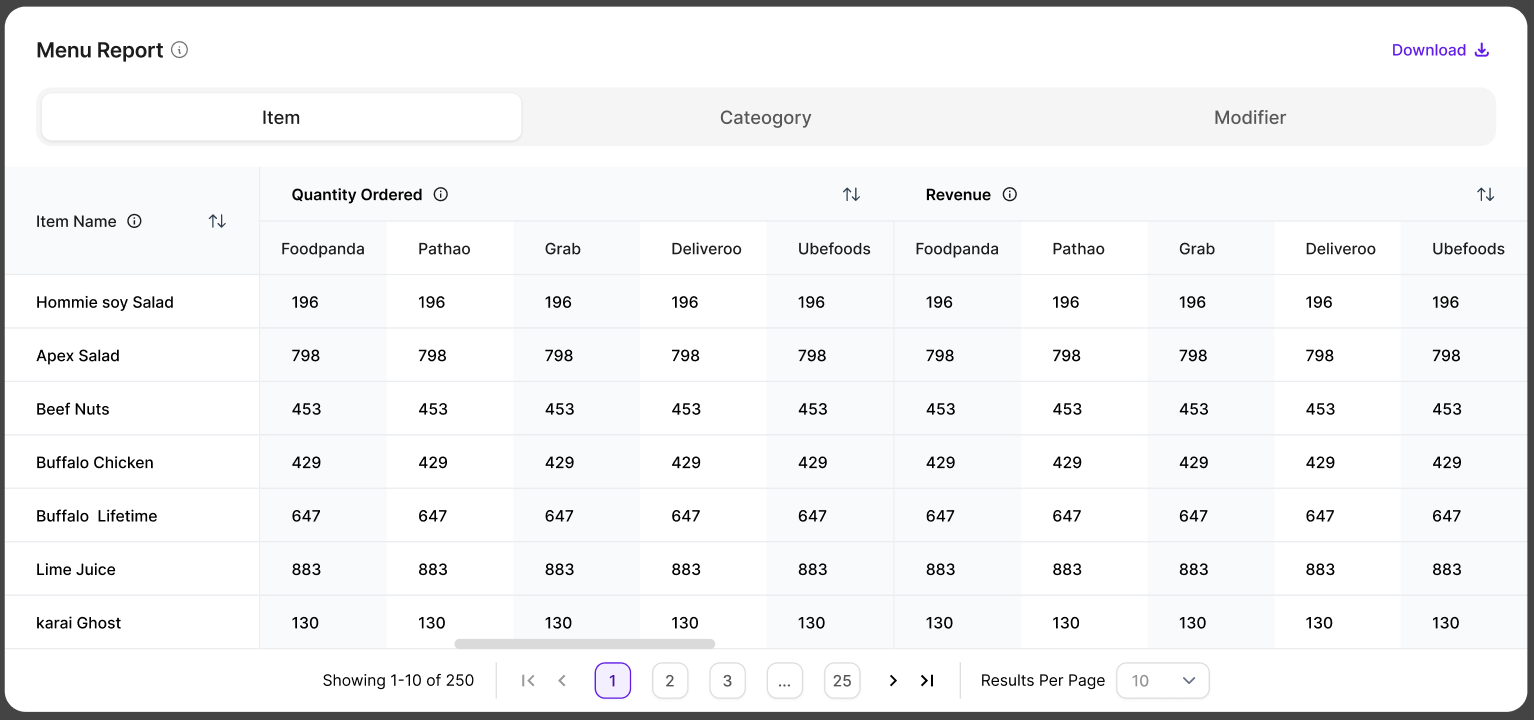
Orders per Menu Category, Menu Item, and Modifier
- Dive deep into your product offerings to understand customer preferences - with a feature that allows you to toggle, compare and filter by aggregator in the menu category, item and modifier report. You may download the report as CSV file. The downloaded file also support comparisons between brands and branches.
- Filtered by Aggregator
Discounts Data
- Track the effectiveness of your discount strategies and promotions. You may download the report as CSV file.
Pause Store
- See when and why your store, brands and branches were paused. You may download the report as CSV file.
Order Breakdown Data
- Get detailed insights into the composition of your orders, including cancellation reasons and preparation times for orders. You can download the report as a CSV file.
These reports are available to export and download as needed. It's important to note that klikit Analytics only includes stores that are Powered by klikit. Therefore, the more stores you have integrated, the more comprehensive and powerful your analytics report becomes.
My data is different or incorrect, how do I fix this? What should I do if there are discrepancies in my data?
If you notice a discrepancy in your data, please submit a Data Discrepancy Form.
If you notice a discrepancy in your orders, or alternatively the status of a certain order has not been reflected on your Order Dashboard, please submit an Order Amendment Request.
This will streamline our process for patching the orders up in our system on your behalf with confirmation that the order was either 'Completed' or 'Cancelled'. This will ensure your Analytics are fully up to date and consistent.
Need Help? Contact us on Live Chat
Tap "Live Chat" button on the right bottom corner your screen
Related Articles
What is a X/Z-report?
A Z-report is a printed summary of your transactions of a single day at a selected date only while X-reports is a printed summary of your transactions of a single day at a selected date and time. Only branch managers can generate this report. You can ...How do I see new orders? How do I edit an order? How do I troubleshoot the Order Dashboard?
Managing your orders has never been easier with klikit! This guide will help you navigate and optimize your use of the klikit Order Dashboard, from understanding its layout to troubleshooting issues. What is the klikit Order Dashboard? The klikit ...How do I cancel an order? How do I recover a cancelled order?
How do cancelled orders work? Some delivery apps will 'Cancel' orders if not accepted on the klikit Store App. Please use the device! Cancelled Orders encapsulate orders that have either been (a) cancelled by Staff on the Store App or (b) cancelled ...How to Update Completed Order Status for Add Order and Webshop Orders
Business Owners and Area Managers can now update the status of Add Order and Webshop orders This gives greater flexibility when correcting order status mistakes directly from the klikit Order Dashboard. Updates can be done for completed orders under ...What is the Order Dashboard?
The klikit Order dashboard serves as your central hub for managing and viewing all aspects of your order deliveries. From this home screen, you can easily access and control your current and past orders based on brands, locations, status, and ...